Usage
To use Django ReportCraft, Navigate to https://mysite/reports/editor/ and create a new report entry by clicking the + Add button from the Reports list.
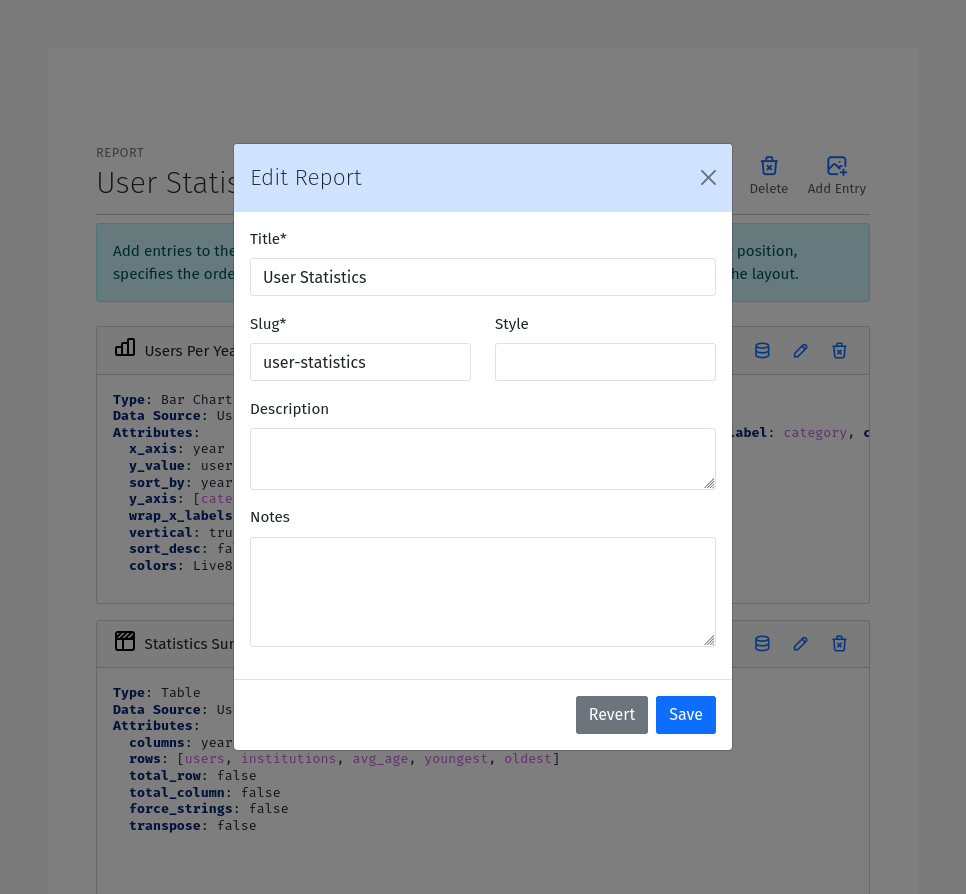
Title: The title of the report. This should be a human readable string.
Description: A description of the report. Use this to provide additional information about the purpose of the report.
Section: A slug to use for grouping reports. This could be any valid slug
Style: a css class to apply to the report. This can be used to apply custom styles to the report.
Notes: Notes to display with the report. Notes are often used to provide additional information about the report.
Once you have created a report, you can build the report using the graphical designer by creating Data Sources, Data Fields, and Report Entries.
Data Sources
A Data Source is a model that provides data for the report. You can create a new Data Source by clicking the :guilabel:` + Add` button from the Data Sources list. To create a new Data Source, you need to provide the following information:
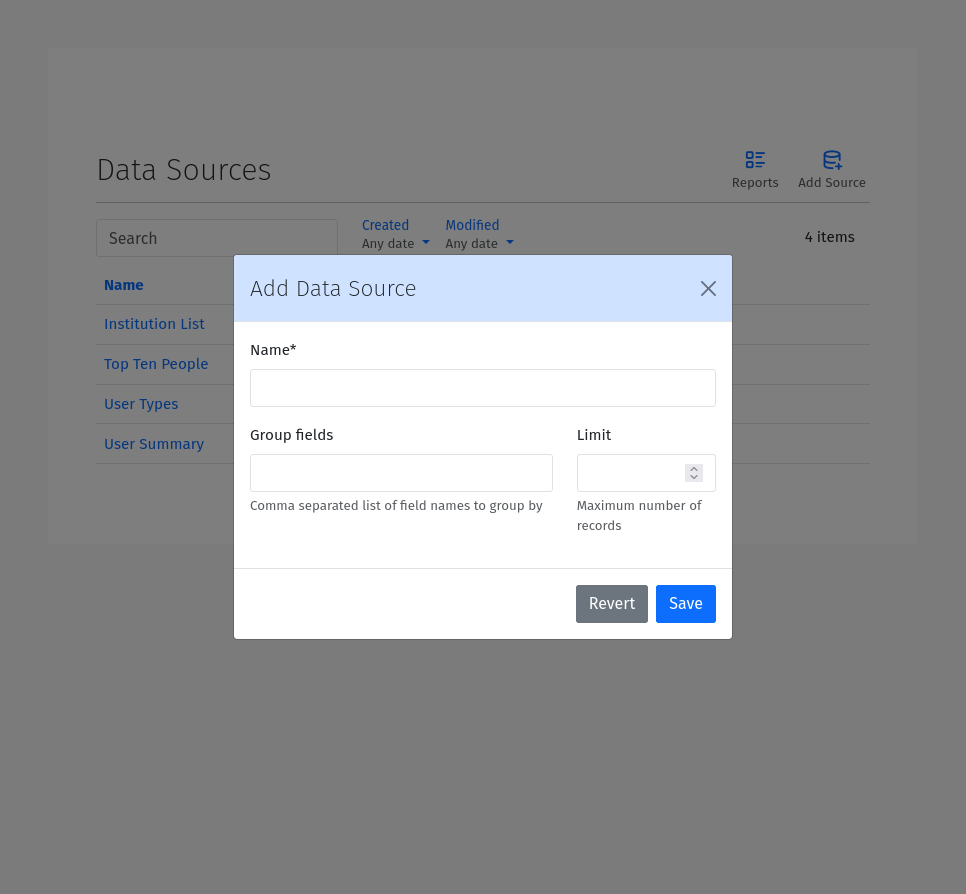
Name: The name of the Data Source.
Group Fields: A comma separate list of group fields to use for aggregating the data.
Limit: The maximum number of records to return. This field is optional.
Description: A description of the Data Source. Use this to provide additional information about the purpose of the Data Source.
Filters: Filters to use for selecting a subset of the data. Filters are used to limit the data returned by the Data Source. The filters should be a valid Filters. See the Filters section below.
As you build the data source, you can preview a snippet of the data in the Data card at the bottom of the page, and even use the download button to download a JSON representation of the full data set.
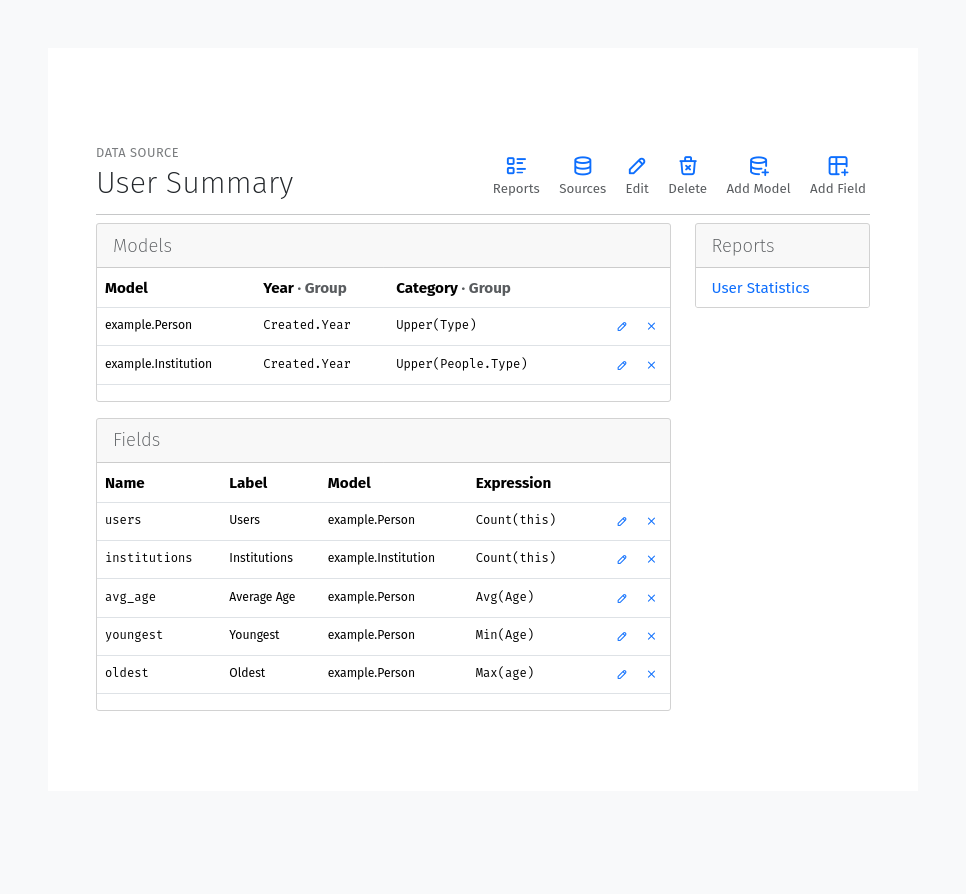
Data Source Models
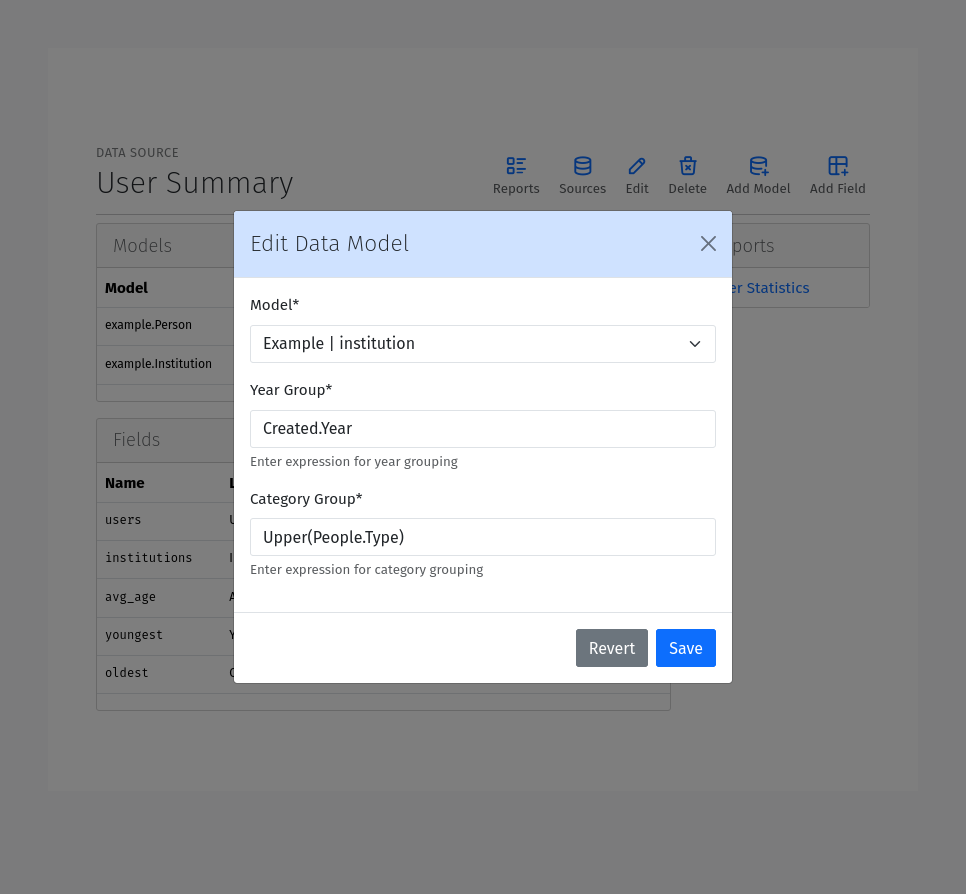
After creating a Data Source, you can add Models to it. Models need to be added first, as all Data Fields are linked to specific models defined within the Source. Models can be added by clicking the Add Model button from the Data Source editor pages. To add a new Model, you need to provide the following information:
Model: The model to use for the data source. Select a model from the dropdown list. Only models that are part of applications whose app_label is included in the REPORTCRAFT_APPS setting list will be available.
Group Expressions: For each group field, you can provide an expression to use for grouping the data. The expression should be a valid Expression. See the Expressions section below.
Data Fields
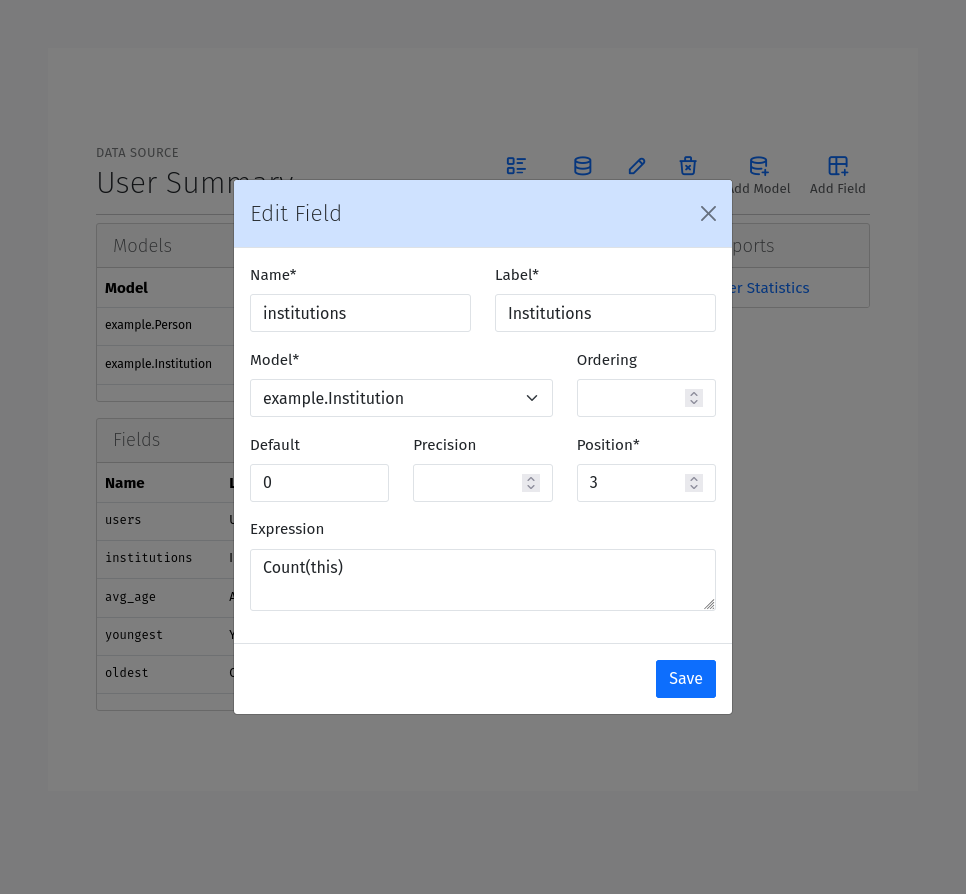
After adding a Model, you can add Fields to it. Fields can be added by clicking the Add Field from the Source Editor page. The following information is required to add a new Field:
Name: The name of the field. This should be a valid identifier. We recommend using snake_case for the field name. When the field name matches a field already present in the model, the data will be fetched from the model field and the expression will be ignored.
Label: The label to use for the field in the report. This should be a human readable string.
Model: The model to use for the field. Select a model from the dropdown list. Only models that have been added to the Source, are available.
Ordering (optional): A signed integer to use for ordering by the values of the field. Larger magnitutes get precedence, and the sign determined the order (ascending or descending).
Default (optional): The default value to use for the field if no entries are found.
Precision (optional): The number of decimal places to use for the field. Values are rounded to the specified precision.
Position: The position of the field relative to other fields in the report. While the Ordering field is used for ordering the data, the Position field is used for ordering the fields in the report.
Expression: The expression to use for the field. The expression should be a valid Expression. See the Expressions section below. The expression is required for fields that do not already exist in the model.
Expressions
Expressions are used to define how to calculate the value of a field. Expressions can be simple field references or Mathematical expressions. The following operators are supported:
+: Addition
-: Subtraction
*: Multiplication
/: Division
-: Unary negation
Django field names are referenced using CamelCase. For example, to reference a field named total_amount, you would use TotalAmount in the expression. Related fields lookups must be referenced using the . operator instead of the __ operator. For example, to reference a related field named name on a related model named institution, you would use Institution.Name in the expression instead of the low-level name__institution identifier.
Any unquoted identifier that is not a function or a literal is assumed to be a field name. For example, TotalAmount * 0.1 would multiply the value of the TotalAmount field by the value 0.1. You can also use parentheses to group expressions. For example, (TotalAmount + TaxAmount) * 0.1 would add the value of the TotalAmount field to the value of the TaxAmount field and then multiply the result by 0.1. String literals must be enclosed in single or double quotes. For example, ‘Hello, World!’.
Functions must use parentheses immediately after the identifier to enclose arguments. Nesting and keyword arguments are supported.
The special this identifier can be used to reference the current model. For example, the expression Count(this) on a field defined for the example.Person model, would count the entries in the example.Person model. This can be especially useful when using the Count function with the distinct keyword, like Count(this, distinct=True).
The following Django database functions are supported. Please consult the Django documentation on Database Functions for more information:
[
    Sum, Avg, Count, Max, Min, Concat, Greatest, Least,
    Abs, Ceil, Floor, Exp, Ln, Log, Power, Sqrt,
    Sin, Cos, Tan, ASin, ACos, ATan, ATan2, Mod, Sign, Trunc,
    ExtractYear, ExtractMonth, ExtractDay, ExtractHour, ExtractMinute,
    ExtractSecond, ExtractWeekDay, ExtractWeek,
    Upper, Lower, Length, Substr, LPad, RPad, Trim, LTrim, RTrim,
    Radians, Degrees, Q, ArrayAgg, DisplayName, Interval
    ShiftStart, ShiftEnd, Hours, Minutes, CumSum, CumCount
]
Additionally, the following custom functions functions are supported:
ShiftStart: Round down the time of a DateTime field to the nearest hour. An extra size keyword argument can be used to specify the shift size, by default 8 Hrs (00:00, 08:00, 16:00).
ShiftEnd: Round up the time of a DateTime field to the nearest 8 Hrs (08:00, 16:00, 00:00). Also takes the optional size keyword argument.
Hours: Calculate the total hours from a Duration. A duration is a difference between two DateTime fields.
Minutes: Calculate the total minutes from a Duration.
Join: Join a list of strings into a single string using a separator. The separator can be specified using the separator keyword argument, which defaults to a comma (,). For example, Join(Authors, separator=’, ‘) would join the authors into a single string separated by commas.
DisplayName: Gets the display name for of Django choice fields
CumSum: Calculate the cumulative sum of a numeric field over an ordered set of rows. Takes two parameters. The first is the field to sum, and the second is the order. For example, CumSum(Sales, Date) would calculate the cumulative sum of the Sales field ordered by the Date field.
CumCount: Calculate the cumulative count of rows over an ordered set of rows. Takes two parameters. The first is the field to count, and the second is the order. For example, CumCount(Item, Date) would calculate the cumulative count of items ordered by the Date field. sum of the Sales field ordered by the Date field.
Interval: categorize a numeric field’s value into dynamically generated intervals. For example:
Interval(Age, lo=18, hi=65, size=4)
Will generate a string annotation with four categories ‘<18’, ‘18-40’, ‘40-65’, ‘>65’ based on the age value
Note
The Join and ArrayAgg functions are only available on PostgreSQL databases. If you are using a different database, you can implement a custom function to achieve similar functionality.
For date based fields, you can use subfields to extract parts of the date. For example, instead of using a function to extract the year from a date field like ExtractYear(Date) in the expression. It is valid and much easier to use Date.Year.
You can also implement custom functions by subclassing the django.db.models.functions.Func class and registering the function by listing the full path to the class in the REPORTCRAFT_FUNCTIONS setting. For example:
from django.db.models import Func, TextField

class MyCustomFunction(Func):
    function = 'MY_CUSTOM_FUNCTION'
    template = '%(function)s(%(expressions)s)'
    output_field = TextField()

REPORTCRAFT_FUNCTIONS = [
    'myapp.functions.MyCustomFunction',
    ... # other functions
]
Here are some xamples of valid expressions:
TotalAmount * 0.1
(TotalAmount + TaxAmount) * 0.1
TotalAmount + TaxAmount
'Hello, World!'
Concat(FirstName, " ", LastName)
Sum(TotalAmount)
Sum(TotalAmount) / Count()
Sum(Metrics.Citations) + Avg(Metrics.Mentions)
Sum(Metrics.Citations - Metrics.Mentions)
Avg(Metrics.Citations + Metrics.Mentions)
Published.Year
-Count(this)
Count(Journal, distinct=True)",
Concat(Journal.Title, ' (', Journal.Issn, ')')
Avg(Journal.Metrics.ImpactFactor)
Avg(Metrics.Citations) / Avg(Metrics.Mentions)
Filters
Filters are used to limit the data returned by a Data Source. Filters must only use fields added to the Data Source. Native low-level model fields are not supported. Filters are boolean expressions defined using the following extended Python-like syntax:
[
    'field_name operator value',
    '(field_name operator value) and (field_name operator value)',
    '(field_name operator value) or (field_name operator value)',
    '(field_name !operator value)',
    '( field_name operator value ) and ( field_name operator value )'
]
Field names are case-insensitive and must match the names of the fields added to the Data Source. values can be strings, numbers, or boolean values. Boolean values are case-insensitive, such that TRUE, True, true are all valid. Strings must be enclosed in single or double quotes.
Parentheses are always required around the basic field_name operator value expressions when combined. Several levels of nesting are supported, and the expressions can be combined using the and and or operators.
The following operators are supported:
= or ==: Equal to
!=: Not equal to
<: Less than
<=: Less than or equal to
>: Greater than
>=: Greater than or equal to
has: contains a value
^=: String starts with
$=: String ends with
^~: Case-insensitive string starts with
$~: Case-insensitive string ends with
~=: Case-insensitive string equals
~has: Case-insensitive string contains a value
regex: Value matches a regular expression
isnull: Value is null (or empty)
Unlike Python, the ! operator modifier can be prefixed to any of the above operators (except for !=) to negate it. For example, the following expressions are valid:
'total_amount > 100'
'journal != "Nature"'
'journal isnull True'
'total_amount !> 100'
'(total_amount > 100) and (journal != "Nature")'
'(total_amount !<= 100) and (Journal != "Nature")'
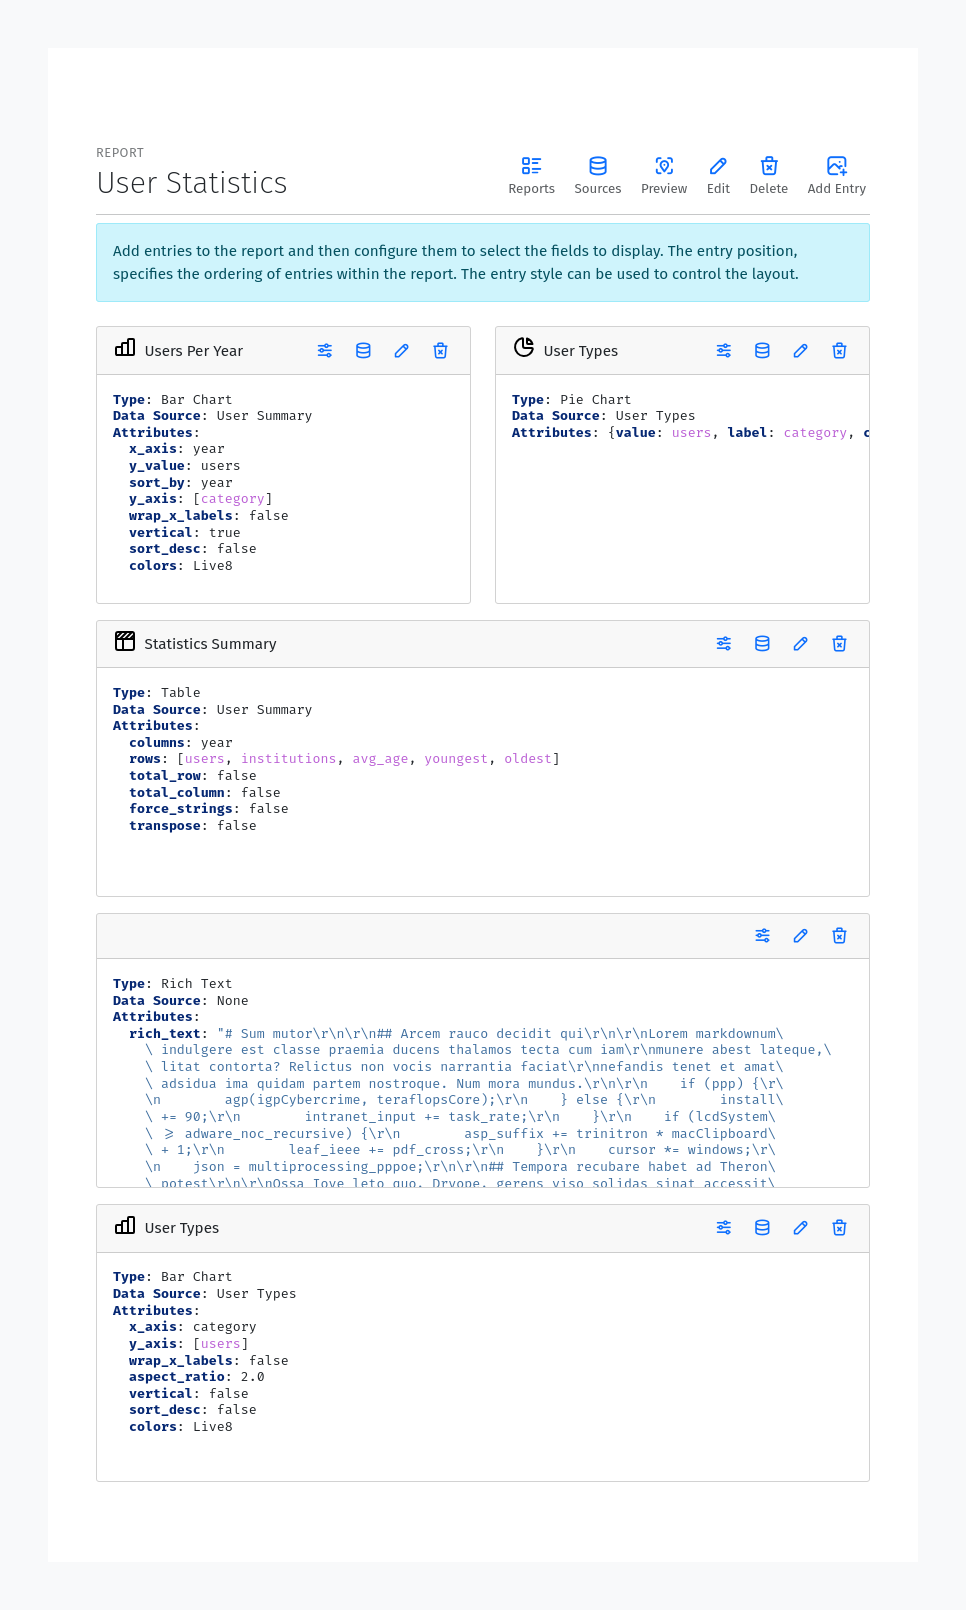
Report Entries
A report is made up of a collection of entries. Each entry is a single component that can be displayed in a report. You can create a new entry by clicking the Add Entry button from the Report Editor page. To create a new entry, you need to provide initially the following information:
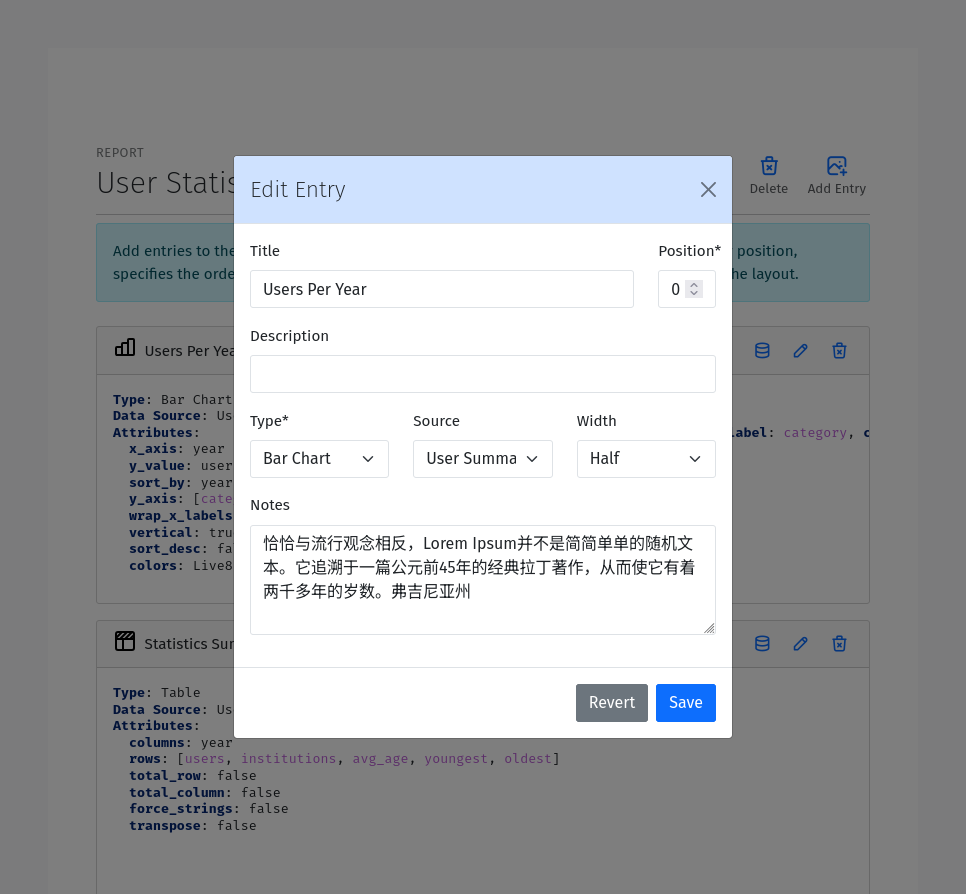
Title (optional): The title of the entry. This will be displayed as either the heading of the entry or the caption of the table or chart.
Position: The position of the entry relative to other entries in the report. The position is used to order the entries in the report.
Description (optional): A description of the entry. This will be displayed as a paragraph of text at the top of the entry.
Notes (optional): Notes to display at the bottom of the entry. Notes are often used to provide additional information about the entry.
Data Source: The data source to use for the entry. Select a data source from the dropdown list. Only data sources that have been added to the report are available.
Width: The width of the entry. The width is used to determine how much space the entry takes up in the report. The width is a fraction of the total width of the report. The following widths are supported:
Full: The entry takes up the full width of the report.
Three Quarters: The entry takes up three quarters of the width of the report.
Two Thirds: The entry takes up two thirds of the width of the report.
Half: The entry takes up half of the width of the report.
Third: The entry takes up a third of the width of the report.
Quarter: The entry takes up a quarter of the width of the report.
Type: The type of the entry. The type determines how the data is displayed. The following types are supported:
Table: A table that displays the data in a tabular format.
Bar Chart: A chart that displays the data in a bar chart format.
Pie Chart: A chart that displays the data in a pie chart format.
XY Plot: A chart that displays the data in a XY chart format with lines or points.
Chart: A chart that displays the data in a graphical format.
Histogram: A chart that displays the data in a histogram format.
Text: A text entry that displays the data as a paragraph of text.
List: A special type of table that displays a list of entries. Each row in a List is usually quite similar to the other rows unlike a Table.
Rich Text: A text entry that displays markdown formatted text.
Once you have created an entry, you can configure it using the toolbar icons on the entry. The specific configuration options depend on the type of the entry.
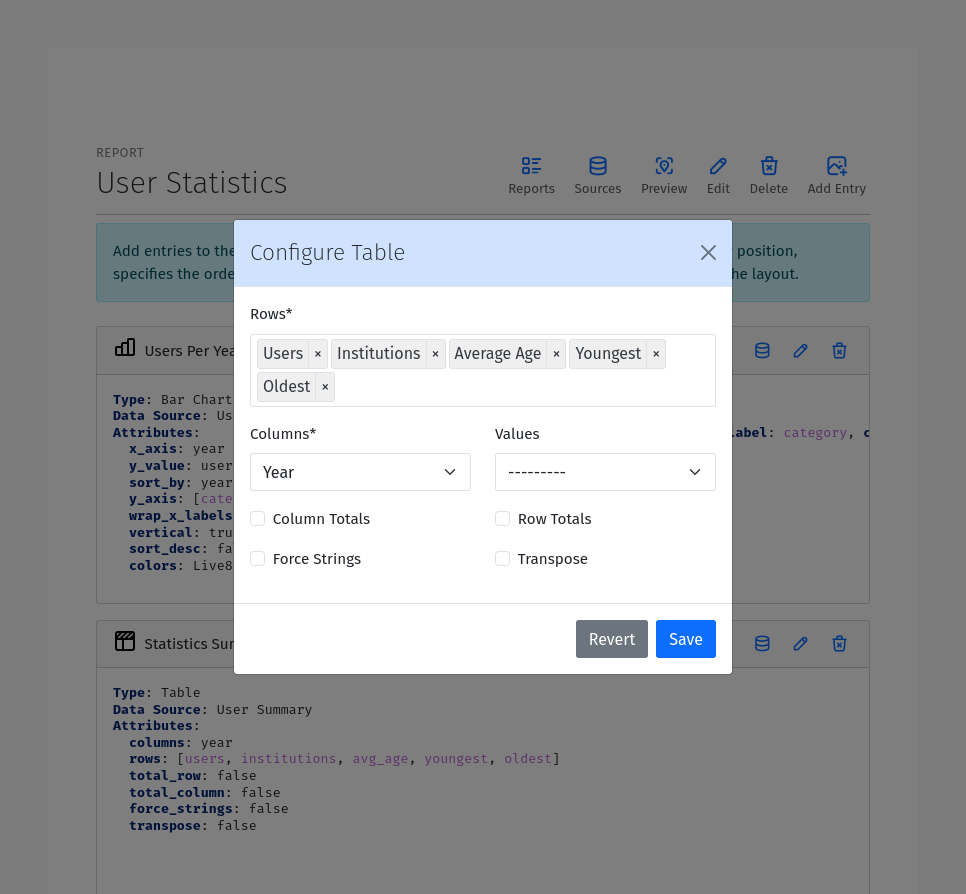
Table Entry
A Table Entry displays the data in a tabular format. The table entry has the following configuration options:
Rows: One or more fields to display as the rows of the table. Select the fields to display as the rows from the dropdown list. Only fields that have been added to the data source are available.
Columns: The field to use as the columns of the table. For example, if the data is grouped by Year, the Year field would be an appropriate Column field.
Values: The fields to use as the values of the table when a single field is specified under Rows. In this case, the Values of the Rows field will be used as the columns and the table cells will contain corresponding values from the Values field.
Max Columns: If the table has more than this number of columns it will wrap to additional tables.
Column Totals: Toggle to add a row at the bottom of the table that contains the totals for each column.
Row Totals: Toggle to add a column at the right of the table that contains the totals for each row.
Transpose: Flip the rows and columns of the table. This is useful when the data is more naturally displayed with the rows as columns and the columns as rows.
Force Strings: Convert all values to formatted strings.
Flip Headers: Make headers vertical
Wrap Headers: Wrap header text to multiple lines if needed
Bar & Column Chart Entries
A Bar Chart Entry displays data with a horizontal bar chart, while a Column Chart entry uses vertical bars. They have the following configuration options:
Categories: The field to use as the category axis of the chart.
Values: The field to use as the values of the chart. This field will be used to determine the height/length of bar. If multiple values are provided, they will be used as independent series.
Type: Whether to use grouped or stacked bars.
Color By: The field to use for coloring the bars.
Sort By: The field to use for sorting the bars on the x-axis.
Sort Descending: Sort the bars in descending order.
Value Scale: The scale for the value field.
Limit: Maximum number of bars to show. Usually used together with sorting
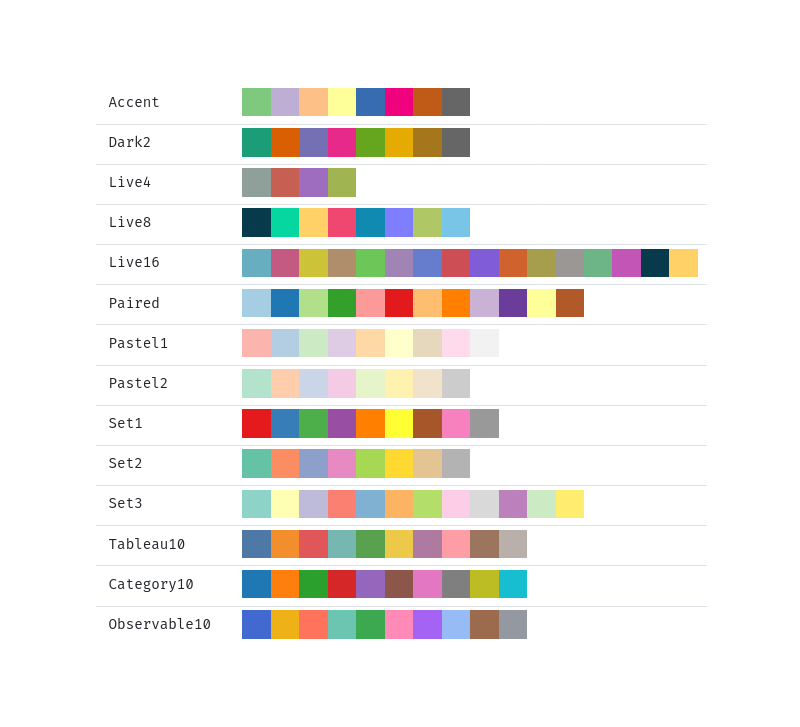
Color Scheme: The color palette to use for coloring the bars. The following color schemes are supported:
Pie Chart Entry
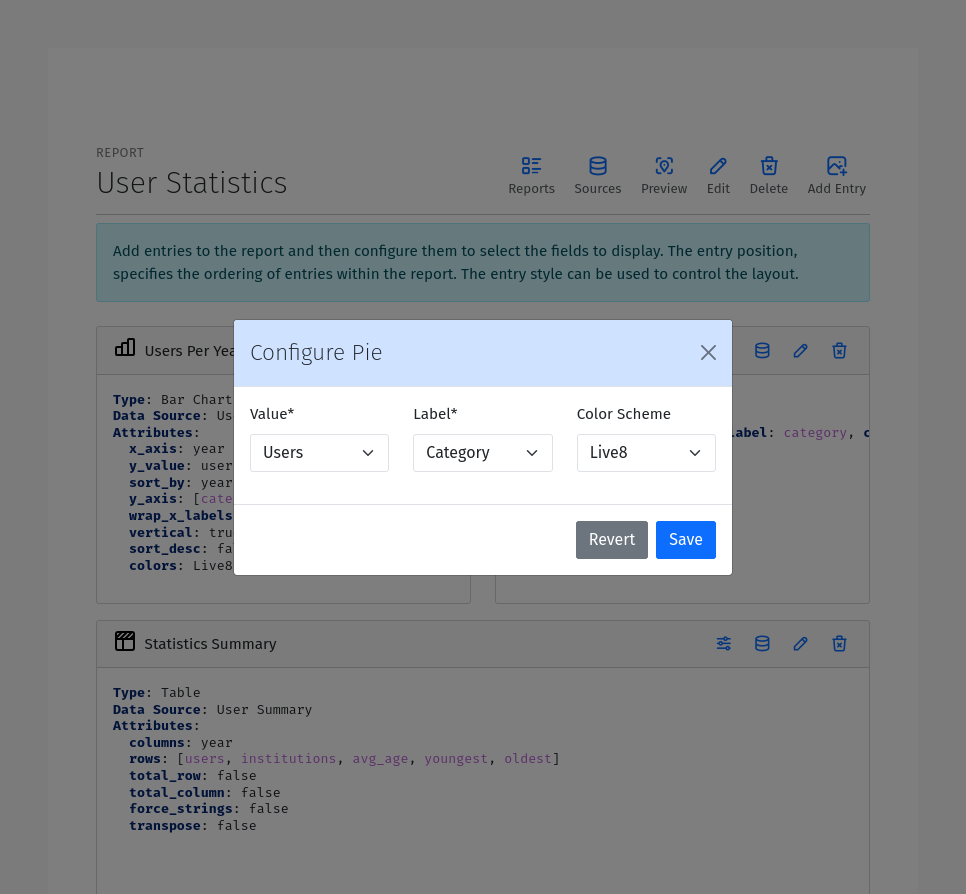
A Pie Chart Entry displays the data in a pie chart format. The pie chart entry has the following configuration options:
Value: The field to use as the values of the chart. This field will be used to determine the size of the slices in the pie chart.
Label: The field to use as the labels of the chart. This field will be used to label the slices in the pie chart.
Color By: The field to use for coloring the slices.
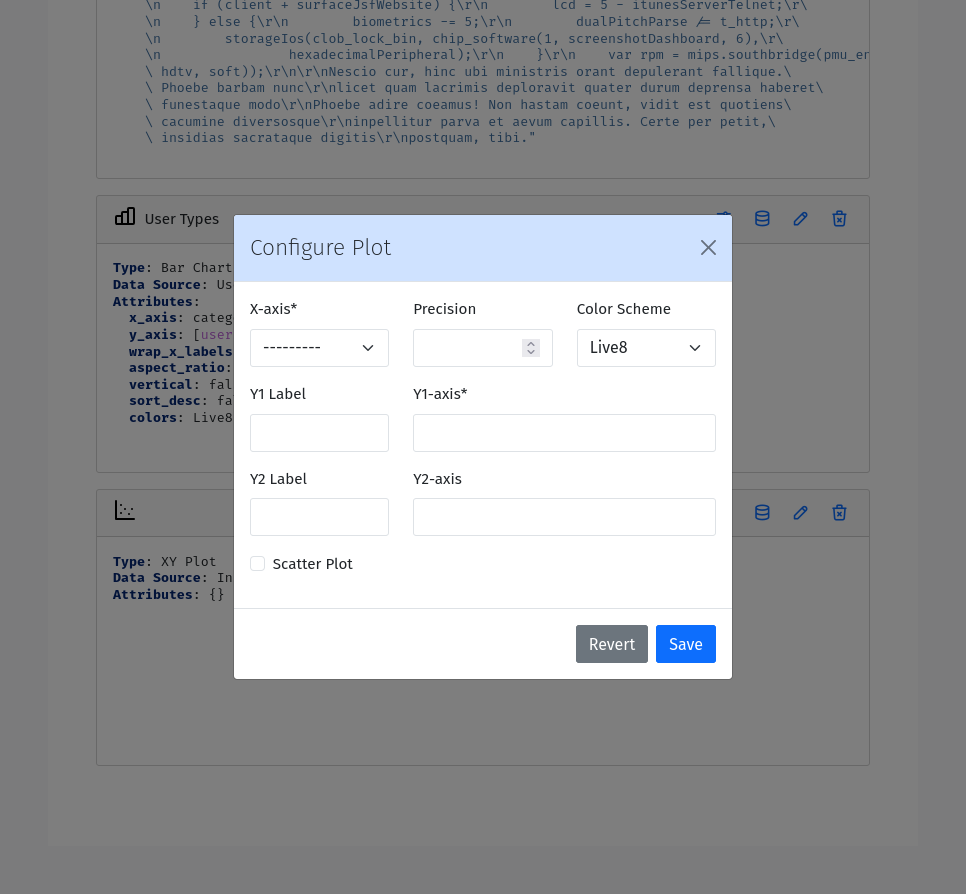
XY Plot
An XY Plot Entry displays the data in a XY chart format with lines or points or areas. The XY plot entry has the following configuration options:
X Value: The field to use as the x-axis of the chart.
X Label: The label to use for the x-axis.
Y Label: The label to use for the y-axis.
Group By: Field to use from grouping series
X-Scale: Scale of X-axis
Y-Scale: Scale of Y-axis
Precision: The precision of tick values
Color Scheme: The color palette to use for coloring the lines or points. Each series will be assigned a color based on the color scheme.
Plot Series: One or more plots, each with the following settings
Y-value: The Y-axis value.
Z-value: An optional third dimention of data. The meaning varies by plot type. Not relevant for all plot types.
Scatter Plot: Toggle this option to display the data as a scatter plot instead of a line plot.
Type: The type of plot
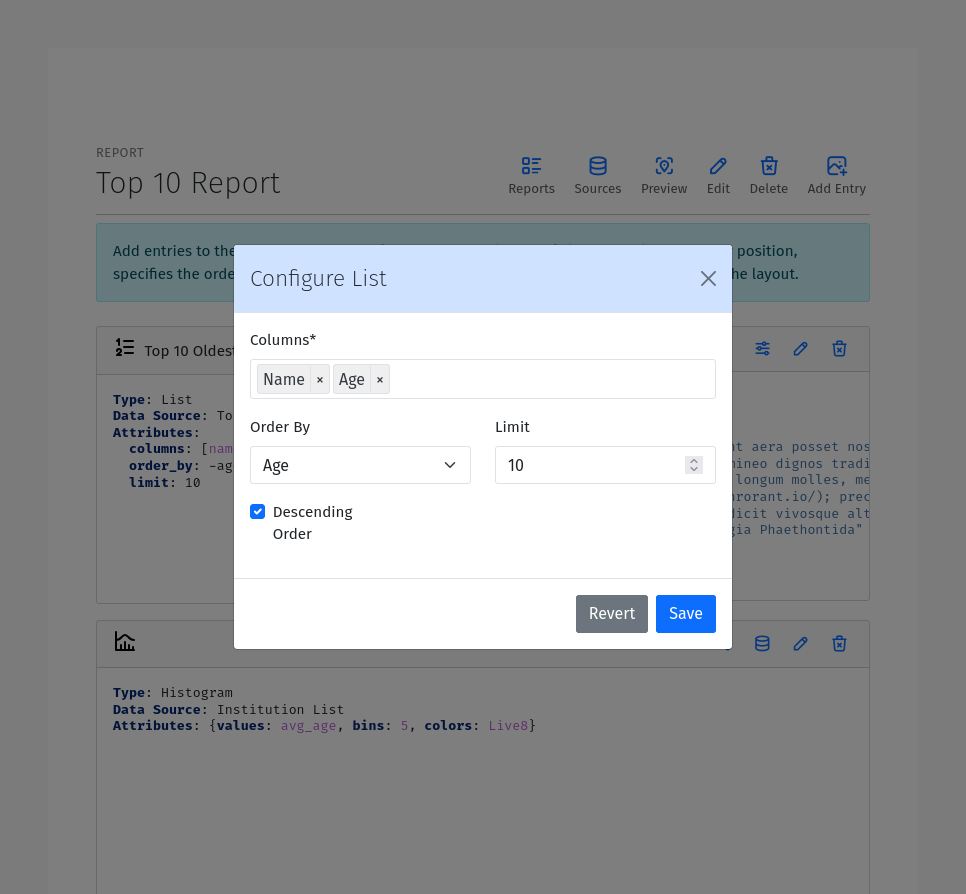
List Entry
A List Entry displays a list of entries with one or more columns of data, where. Each row in a List is usually quite similar to the other rows unlike a Table Entry. The List Entry has the following configuration options:
Columns: The fields to display as columns in the list. Select the fields to display as columns from the dropdown list. Only fields that have been added to the data source are available. You can add multiple columns to the list. The order of the columns in the list is determined by the Position of the corresponding field.
Sort By: The field to use for sorting the rows in the list.
Descending: Sort the rows in descending order.
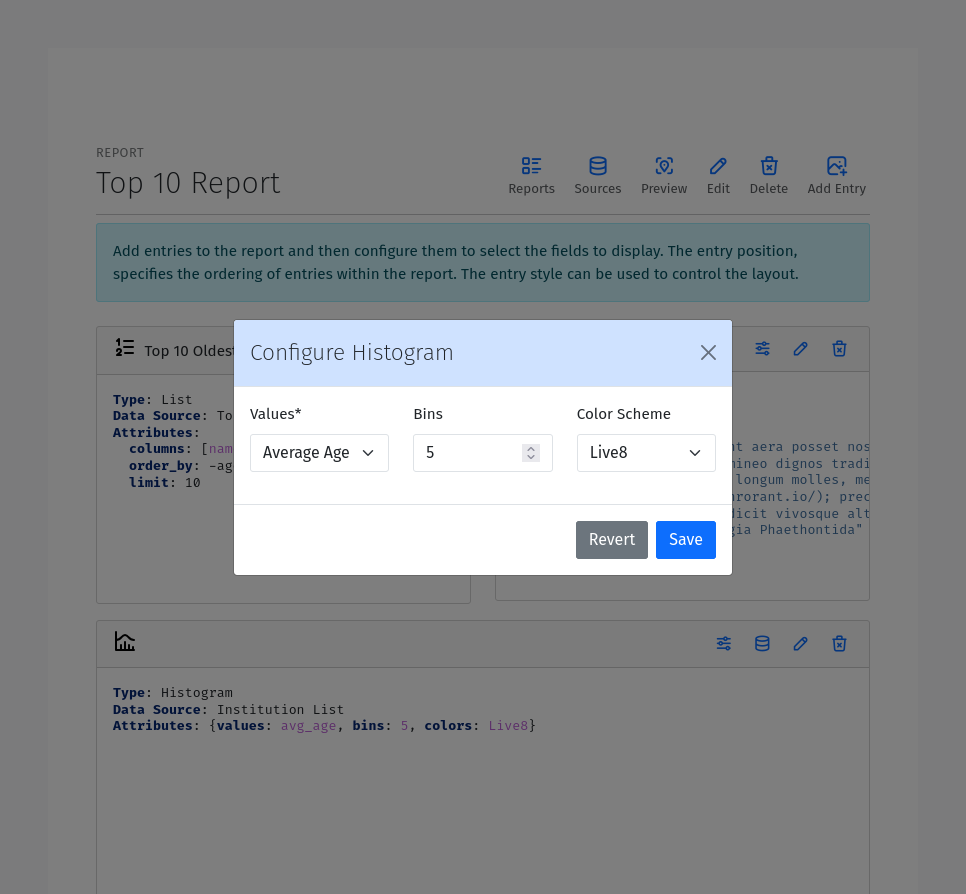
Histogram Entry
A Histogram Entry displays the data in a histogram format. The histogram entry has the following configuration options:
Values: The field to use as the source of values for the histogram. This should be a numeric field and should return the raw data, not the histogram itself.
Binning: The algorithm for automatic binning.
Bins (optional): The number of bins to use for the histogram. If not specified, the number of bins will be determined automatically based on the Binning algorithm.
Group By: Field to use for grouping the data.
Stack Groups: Whether to stack or overlay grouped histograms.
Color Scheme: The color palette to use for coloring the bars in the histogram.
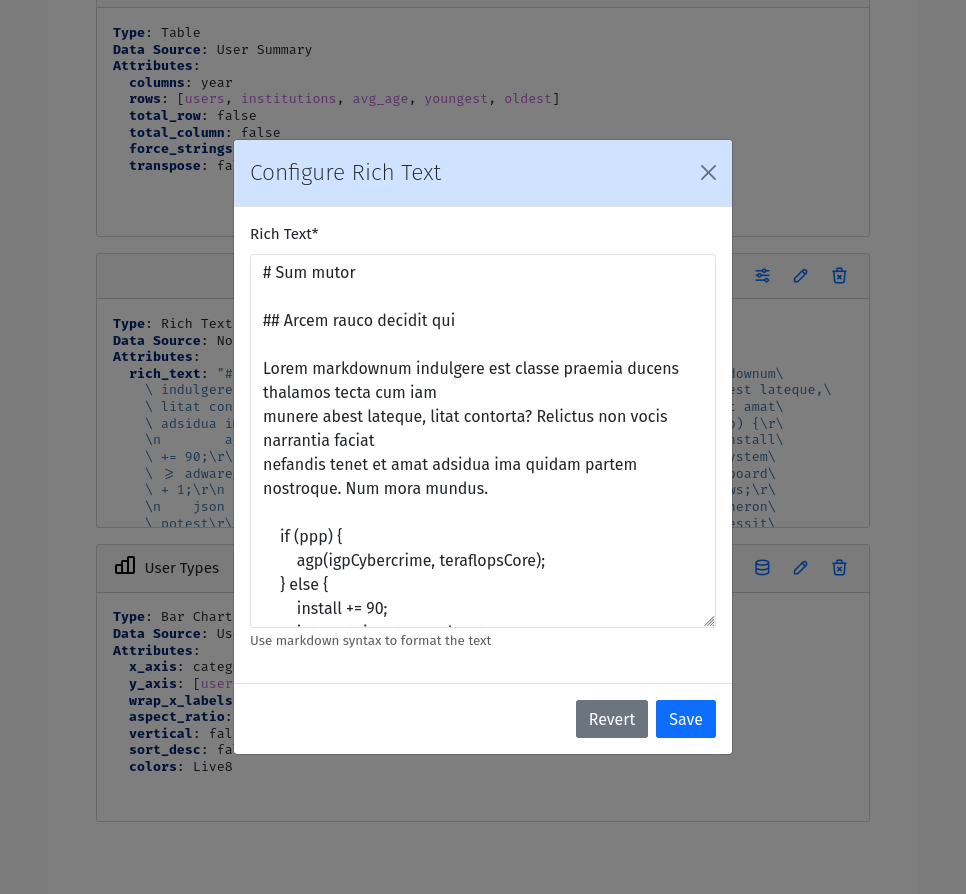
Rich Text Entry
A Rich Text Entry displays markdown formatted text. The rich text entry has the following configuration options:
Text: The markdown formatted text to display in the entry.
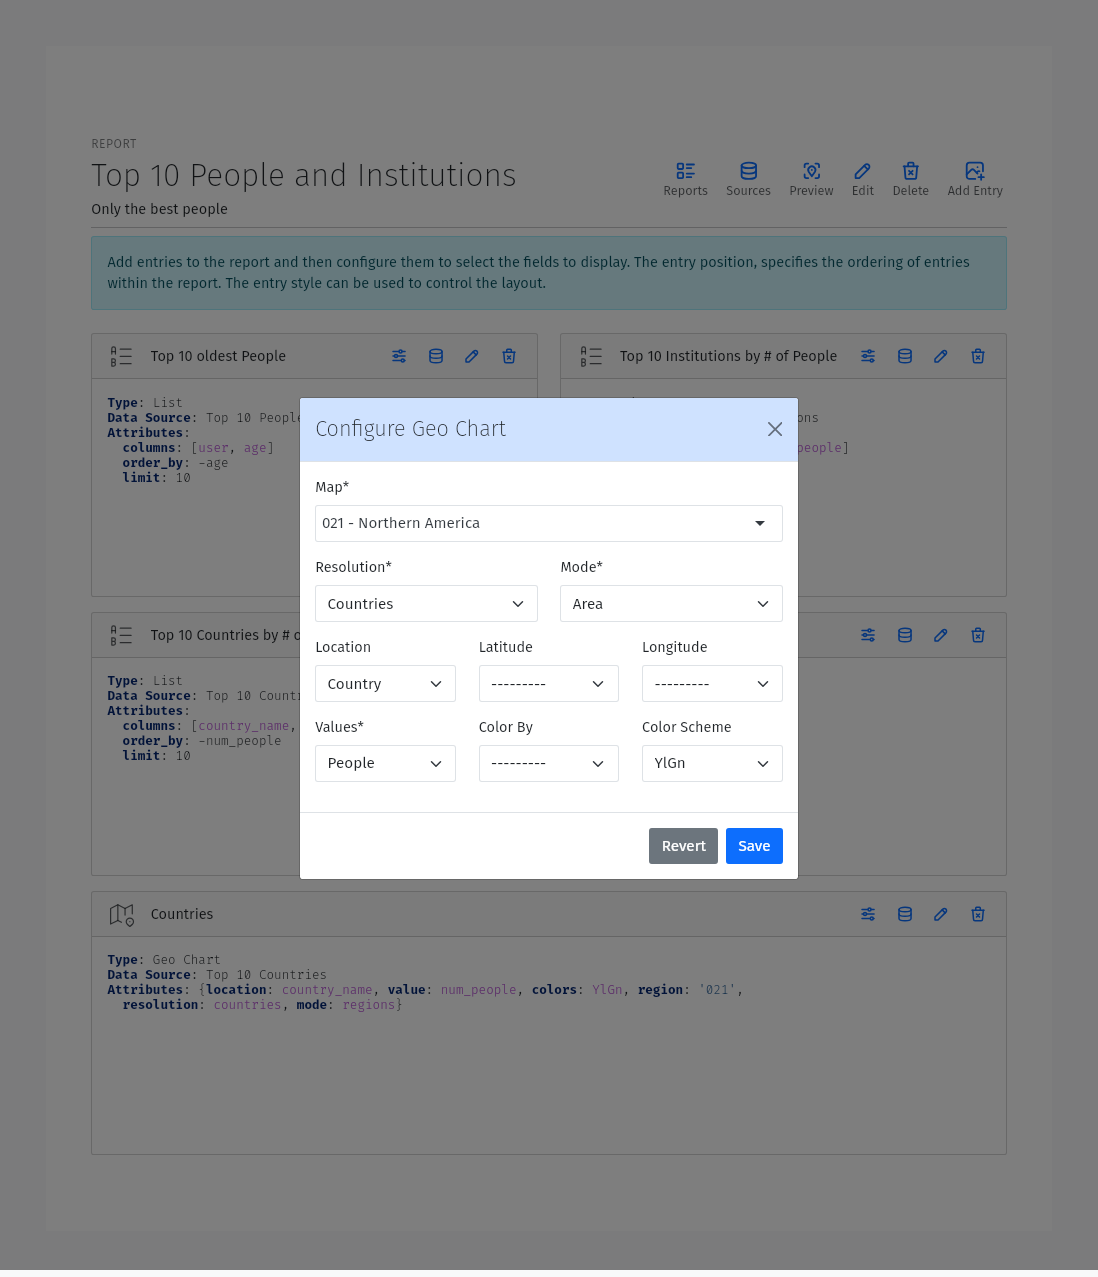
Map / Geo Chart Entry
A Map Entry displays the data in a map format using Google Charts. The map entry has the following configuration options:
map : The map to use. Supported map options include the whole world, continents, subregions and individual countries.
Label: If specified, labels will be added to the centroid of map features.
Location: The field to use as the location of the data. This field should contain the name of the location to display on the map. For World, continent and subregion maps, the location must be be a country ISO-3166-1 3-leter Alpha codes (eg. CAN for Canada, USA for United States). For country maps, the location must be the 2-letter ISO 3166-2 subunit identifier.
Latitude: The field to use as the latitude of the data. This field should contain the lattitude of the location to display on the map.
Longitude: The field to use as the longitude of the data. This field should contain the longitude of the location to
Map features: One or more features to display on the map, each with the following fields:
Type: The feature type.
Value: The field to use as the source of value of the features.
Color Scheme: The color palette to use.
Note
Area features require a location instead of latitude and logitude, while bubbles, density and markers features require latitude and logitude coordinates.
Viewing Reports
Once you have created a report, you can view it by clicking the Preview button from the Report Editor page to view the report.
A list of all reports can be viewed by navigating to https://mysite/reports/view/ and selecting the report from the list. Access to this page will be restricted according to the Mixins specified in the ReportCraft settings. Alternatively, you can override the reportcraft.views.ReportIndexView, reportcraft.views.ReportView to generate a new index with custom permissions. Override the get_limit_section method to return a section name to only include reports from that section in the index. In this case, also override reportcraft.views.DataView to customize access to the data.
For example:
from reportcraft.views import ReportIndexView, DataView, ReportView

class CustomReportIndex(ReportIndexView):
    link_url = 'custom-report-detail'

    def get_limit_section(self):
        return self.kwargs.get('section', 'default')

class CustomReportData(DataView):
    ...

class CustomReport(ReportView):
    data_url = 'custom-report-data'

    def get_queryset():
        """ custom queryset to check of the user has access to the report """
        ...
urlpatterns = [
    ...
    path('custom-reports/<slug:section>', CustomReportIndex.as_view(), name='custom-report-index'),
    path('custom-report/<slug:slug>/', CustomReport.as_view(), name='custom-report-detail'),
    path('custom-report-data/<slug:slug>/', CustomReportData.as_view(), name='custom-report-data'),
    ...
]